Design and results of algorithms for automated trading programs.
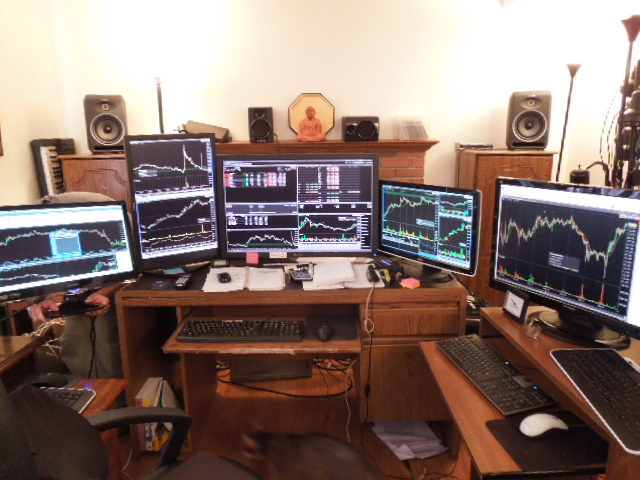
Here's my setup (there are actually two more screens on the right not shown for the Oracle database)
more info on 1 day of trading stocks1.htm
The program is running well,
it scans initially for stocks that are volatile , capable of large changes for
intraday trading, then for volume trends. It watches for large transactions and
market changes and attempts to skim the profits off the resulting trends.
The stocks are watched for
directional trends and reversals. The program
recognizes 4 patterns very well, I'm in the process of adding 5-6 more.
I describe the pattern and then feed historical data into the program and it tunes itself using the data. It builds multiple tables for each pattern and finds the best match against the stocks it's watching (TrendWatch).
It has a confidence factor 0 to
200% on the match and momentum, history, beta value, social and business news.
I have a window pop-up for each of my
TrendWatch processes when it is getting close to an action point (such as a buy
or escalation of confidence) it displays all the parameters and data it has
at the moment. They stack on top of each other with title bars displaying the
major parameters, I can open and watch
each thread graphically. (i'll post pictures of the program tomorrow.)
Thursday was first day of fully automated trading / testing
of my new program Most orders were stopped out immediately because of very tight
stop-loss settings (intentional for now, I'll loosen then as I gain confidence)
, These were the best trades:
CSTM BOT 5.67 SOLD 6.90
ITG BOT 17.78 SOLD 20.26
RLYP
BOT 17.595 ... held
Friday:
RLYP BOT 17.595 had been held overnight .. sold at Friday's opening surge for
20.40
TRIP
-bought TRIP and sold for $2 profit each share (74.03 - 76.04)
Up trend works on finding (varying) >2%-3% trends (it also looks at longer context
hi/low prices also to decide if the trend is likely to continue , also considers
volume/time, news confidence input ratings)
Currently reversals are working best ( like TRIP ).. It
appears to be the easiest pattern for the program to recognize , and it knows
about finding a bottom and waits for a green bar. after it saw a low of 73.57
and then a change red to green.. it triggered a buy
The automated programming appears to be the simple part ...
The real goal seems to me now to be stock scanning and selection to feed into the
evaluation engine ... pick the right stocks and the rest is easy. The program works best in a dynamic rapidly changing market
and it can make better decisions than most investors.
FORUM description
I'm a professional programmer, wrote and continue to write a trading application for IB TWS for myself. My original goal was to create a TWS assistant that could very quickly enter orders with a stop loss and/or profit taker. After that was working I saw how easy it would be to automate trading to different degrees (fully or semi). I am creating a video demonstrating the application. I had no intention of selling the program originally, but have some offers I am considering.
I'm calling this ATS
(Automated Trading System). (it's running on Windows 10 currently, also tested with
W7) I am the author of many programming and database books. Worked for many of
the top companies in the US.
My program currently does:
- Data input
/export (to / from files for contract, ticker info, accounting) , documents to
log files all actions.
- QuickOrder dialog - lets you set buy, sell, stop loss
parameters before they are sent, tracks current positions and is operated by the
user or automated ..
- Assign single function key actions:
-- buy , -buy
with stop loss and/or profit taker (market, limit etc.)
-- sell , sell all ,
scale out (market , limit)
-Uses templates for the setup (stop loss
offset, or trailing stop loss etc.) and single keys can adjust common parameters
(quantity, time-in-force etc.)
-Trend Watch - can watch up to 100 stocks
and can trigger actions when levels are meet. (but can scan thousands of stocks
per second and then input those of interest to the Trend Watch.
For example it can watch for a
3% (any percent) increase and then can trigger the functions described. It
displays a new window for stock (contract) at whatever level (2% for example)
and display the values , the parameters and has buttons to prevent or allow each
action... Or it can just display the QuickOrder dialog when triggered and be in
manual mode.
-Has full access to my account , positions, preferences, ..
so for example, using it as the Assistant :I'm watching a stock, I see a trend and want to enter:
I hit F4 - it buys the stock (100, 1000 or entered) at either market or limit , sets
the stop loss (say 2% or 4% less than last price ..or an offset (-$0.50) . (F5,
F6 toggle quantity and trailing stop loss and offsets to my preferences)
The action is shown in the QuickOrder window and shows up immediately in TWS
orders.
I watch the stock and have options (single key):
F2 - sell all (market or
limit)
F3 - scale out (100, 50, 25 , 33 %)
F4 - buy additional
this
is has been working for over 6 weeks, I use it and improve it everyday.
Now
I'm adding my own scanners to find the stocks I'm interested in (I do mostly day
or swing trading). I would like to show it to get ideas for the next additions
and will create screen snapshots or a video to demonstrate it.
It has
test modes, where it can connect to the simulated trading (paper) account and
can generate stock tick data (prices, volume) etc. that can be used to simulate
market conditions ... has a favorite stock list, 100's of options .. all can be
preset
It does lots more .. the scanning is proving to be the most value, it
can spot trends outside the stocks I've selected and then be added in to my
list.
I'm adding patterns that I know and use. The most basic first such as 1) trend, 2) trend with pullback and continuation or breakout 3) reversals 4) channels (up or down) 5) gappers (sudden changes of price overnight)
The patterns are graphs (outlines) then stored in tables, each table represents one pattern. The actual values are interpolated so they can be stretched or compressed by time frame . Patterns can sequence or be inserted into each other.
(I have programmed lots of waveforms previously, electronic music and sound engineering. So waveforms, graphs, slopes, interpolations and forward prediction on rate of change are familiar to me).
(in a trend) Historic data I find 70% of the time show some larger context for the current trend, and if the price had been much higher in the past, it is likely that a current trend could reach higher levels.. sometimes though a stock is breaking into a new range and redefinition so that history may not apply at all .. that's what makes fishing for a new floor dangerous, the stock may be failing .. and fall to new lows ...
Most of my previous work focused on database engines and data analysis and I had a focus in query (db) tuning ... given market data, the program finds the best pattern match that it knows (currently only 4. soon that will be 10-11 that I've sketched out) then the program makes a prediction (it usually has several alternative plans) .... then after the execution, the program considers the outcome success, views the alternatives that were rejected and then decides if one of them would have worked out better and grades itself .. in the next iteration it will have higher or lower confidence and will weight it's decision accordingly (in the case of a high success, next time confidence will be higher and maybe a little more daring in its buy (maybe earlier) and the sell (maybe will ride out more bumps rather than selling on the first decline) ...
-- confidence can also be injected from me (user) or other processes based on experience, some knowledge particular to the situation or social networks, rating upgrade or downgrade .. etc.
there are other rankings in play such as volatility (these are performance factors, separate from the patterns)
I have a huge library of C# and C++ code that I have created over the last 10+ years .. mostly reusable utility functions (file system, monitor/display management, init file data , email, messaging, debugging, logging, performance evaluation) .. now that I find c# fast enough, I'm moving to all c#, but if some part needs to be in c++ that can be isolated (some math computation, graphing, pattern matching may fall into that area) .. yes multiple parallel processes are running. messaging between them .. no direct calls ..some producer / consumer architecture
(as an aside:: if you know about sound, I extensively used Fourier analysis and it is amazing similar
Fourier analysis is "the process of decomposing a musical instrument sound or any other periodic function into its constituent sine or cosine waves" .. one of my programs just did pattern matching to determine waveforms using a library graphs.. this was originally on mainframes) mostly useful for optimization.
Interesting post regarding you stock buys/sells.
Question ever
look to futures ? Leverage huge however its an index a bit more efficient
leverage is great tho. double edge sword need to calibrate properly
I
always remarked at a "reversal" at 03:00 or 03:30 est time with regards to
previous day close.
For example market selling off yesterday ( or even
intra day) then at 03:00 or 03:30 est program buying and very little pullback (
needs to be measured to some degree as its not straight up) index moves higher
to positive territory on the close or at least unch. This is not THAT frequent
but gut tells me if one could calibrate around the concept the risk reward would
be great, relative to draw down or stop etc
thoughts ?
Thank you
Yes, futures will be my next addition ... before that, I'll be working on
more robust pattern matching. Now my program can overlay a few known patterns
(trends , trends with pullback and breakout, reversals etc.) with the current
market data and decide which is the best match ..
I also see daily
patterns .. ....reoccur...
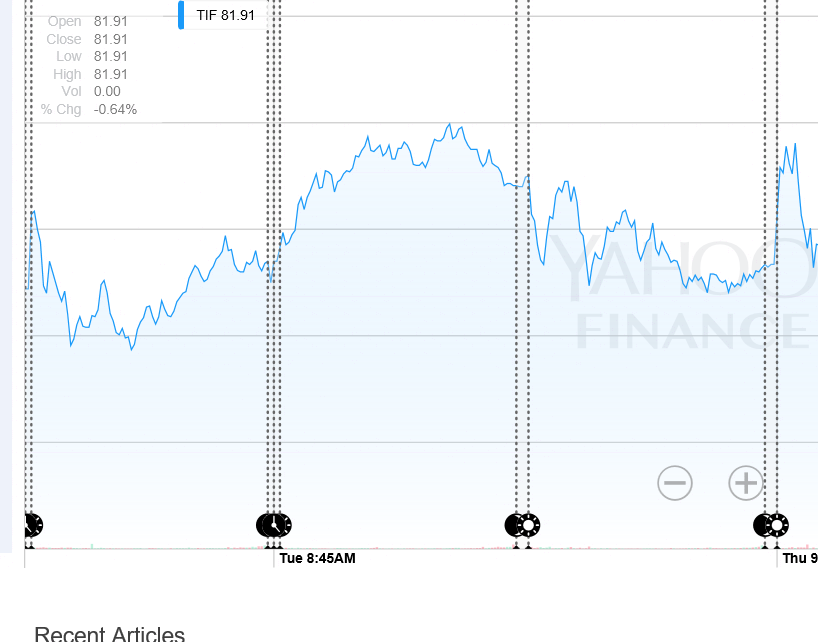
Here's one my
program found ... nearly everyday TIF has a rise and fall in the last 90 minutes
of the day ... computer trading apparently.. so I can (90% of the time) count on
a rise and fall around 3-4PM sometime earlier. This graph is Mon, Tue, Wed of
this week.
Thursday/Fri was some re-evaluations and ratings published ..
changed things... but if you look at the history is consistent..
TIF ...
so it would be good to create templates /outlines, then the program will overlay
it on the current data, (like your example), it could span days .. and then find
if it is generally matching the pattern, the program would make the intelligent
actions for matches...